Fig. 3
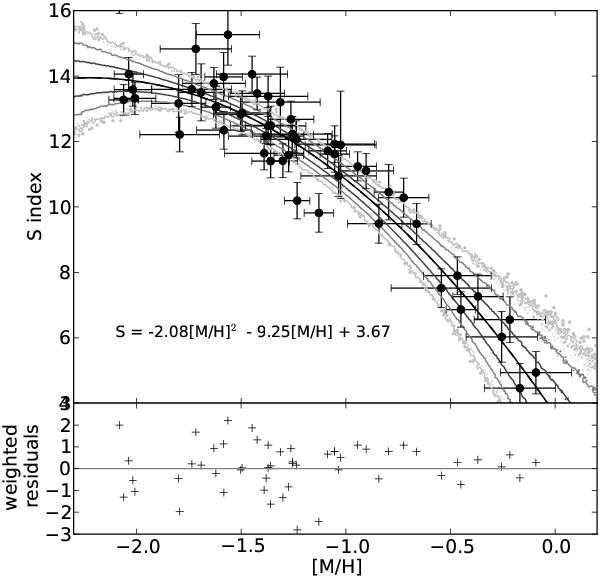
Top panel: RGB slope as a function of metallicity. The solid black line is the best-fit quadratic function, as given in the equation in the bottom left corner. Grey lines give the 1σ, 2σ and 3σ confidence ranges of the the best fit relation. Bottom panel: weighted orthogonal residuals, i.e. the orthogonal distances to the best fit line divided by the respective uncertainties.
Current usage metrics show cumulative count of Article Views (full-text article views including HTML views, PDF and ePub downloads, according to the available data) and Abstracts Views on Vision4Press platform.
Data correspond to usage on the plateform after 2015. The current usage metrics is available 48-96 hours after online publication and is updated daily on week days.
Initial download of the metrics may take a while.