Fig. 3
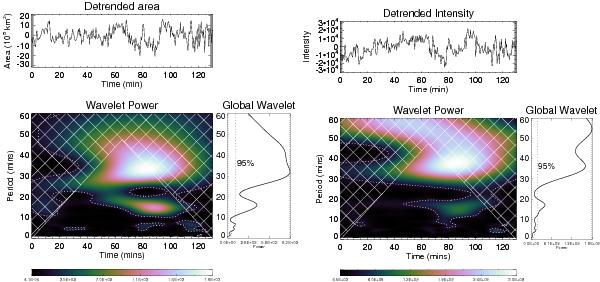
Left image: evolution of the area of the 1999 sunspot (upper panel); the wavelet power spectrum for a white noise background, the cone of influence is marked as a cross-hatched area where edge effects become imporant and the contour lines show the 95% confidence level (lower left panel). Global (integrated in time) wavelet power spectrum, where the dashed line shows the 95% confidence limit (lower right panel). Right image: the same as the left image but for the mean intensity of the 1999 sunspot.
Current usage metrics show cumulative count of Article Views (full-text article views including HTML views, PDF and ePub downloads, according to the available data) and Abstracts Views on Vision4Press platform.
Data correspond to usage on the plateform after 2015. The current usage metrics is available 48-96 hours after online publication and is updated daily on week days.
Initial download of the metrics may take a while.