Free Access
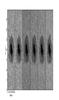
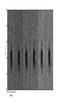
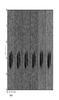
Fig. 2
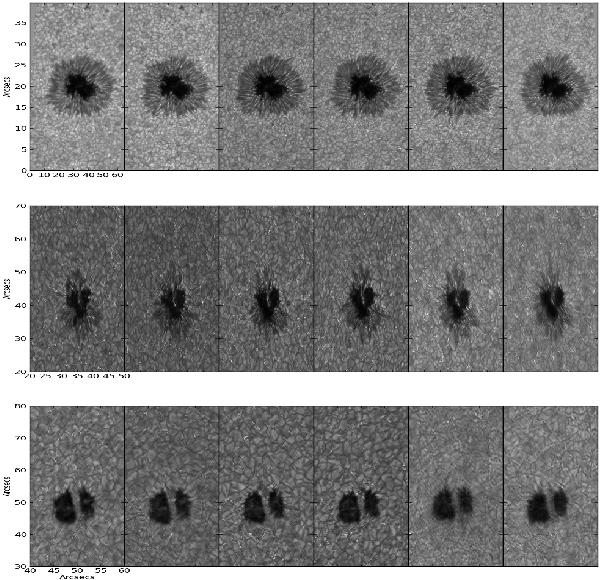
Waveguides seen through six different parts of the observation sequence. The image sequence has time increasing from left to right. The first row is the 1999 sunspot, the middle row the 2005 sunspot, and the last row the 2008 pore.
This figure is made of several images, please see below:
Current usage metrics show cumulative count of Article Views (full-text article views including HTML views, PDF and ePub downloads, according to the available data) and Abstracts Views on Vision4Press platform.
Data correspond to usage on the plateform after 2015. The current usage metrics is available 48-96 hours after online publication and is updated daily on week days.
Initial download of the metrics may take a while.