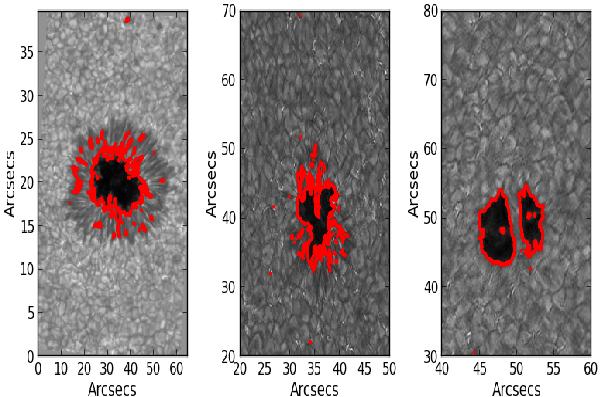
Fig. 1

An overview of the magnetic waveguides observed for this analysis. Left: the 1999 sunspot observed with the SVST with an average umbral area of 19 650 pixels (50 Mkm2). Middle: the 2005 sunspot observed with the DOT with an average umbral area of 12 943 pixels (32 Mkm2). Right: the 2008 pore observed with the DOT with an average area of 10 971 pixels (27 Mkm 2), the light bridge that separates the pore can be seen. Furthermore, these structures were seen near the disk centre, so there is little to no LOS effect. The red line shows the thresholding technique applied to each waveguide at the start of the data series.
Current usage metrics show cumulative count of Article Views (full-text article views including HTML views, PDF and ePub downloads, according to the available data) and Abstracts Views on Vision4Press platform.
Data correspond to usage on the plateform after 2015. The current usage metrics is available 48-96 hours after online publication and is updated daily on week days.
Initial download of the metrics may take a while.


