| Issue |
A&A
Volume 563, March 2014
|
|
|---|---|---|
| Article Number | C2 | |
| Number of page(s) | 2 | |
| Section | Galactic structure, stellar clusters and populations | |
| DOI | https://doi.org/10.1051/0004-6361/201117534e | |
| Published online | 14 March 2014 | |
The Quintuplet cluster
III. Hertzsprung-Russell diagram and cluster age (Corrigendum)
1
Max-Planck Institut für Radioastronomie,
53121
Bonn,
Germany
e-mail:
This email address is being protected from spambots. You need JavaScript enabled to view it.
2
Leibniz-Institut für Astrophysik Potsdam,
14482
Potsdam,
Germany
3
Universität Potsdam, Institut für Physik und Astronomie,
14476
Potsdam,
Germany
Key words: open clusters and associations: individual: Quintuplet / infrared: stars / stars: early-type / stars: late-type / Hertzsprung-Russell and C-M diagrams / errata, addenda
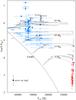 |
Fig. 4 Hertzsprung-Russell diagram of the Quintuplet. Circles (blue) represent the early-type OB stars, triangles (red) the late-type KM stars, filled symbols refer to stars of the corrected sample (see text). The ZAMS and stellar evolution tracks with rotation (solid lines) and without rotation (dashed lines) for different initial masses are from Meynet & Maeder (2003). |
In our paper Liermann et al. (2012) we discovered a sign error. The equation describing the conversion of bolometric corrections from the V-magnitude to the K-magnitude, which is embedded in the text paragraph following Eq. (2), should correctly read as BCK = BCV + (MV − MK). Consequently, the luminosities of all early-type OB stars in Figs. 4–6 must be increased by about 0.8 dex. Here we present the corrected figures.
When comparing the now higher luminosities with isochrones, the OB stars in the Quintuplet cluster appear to be about 3.0 ± 0.5 million years old, i.e., slightly younger than the 4 Myr concluded in the erroneous version. The captions of Figs. 5 and 6 have been updated accordingly.
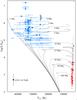 |
Fig. 5 Same as Fig. 4 but with theoretical isochrones for different cluster ages. The isochrones, shown with alternating line styles, were constructed by Lejeune & Schaerer (2001). The majority of the population of OB stars in the Quintuplet falls between the 2 and 4 Myr isochrones, while most KM stars would need more than 30 Myr to evolve |
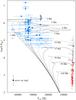 |
Fig. 6 Same as Fig. 5 but with theoretical isochrones based on Girardi et al. (2002). Again, the majority of OB stars falls between the 2 and 4 Myr isochrones, while most KM stars evolve on timescales with more than 30 Myr. |
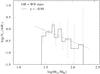 |
Fig. 9 IMF for the early-type OB stars in the corrected sample of the LHO catalog plus the WN stars. The distribution shown has variable mass range bins with a constant number of stars per bin to avoid numerical biases according to Maíz Apellániz & Úbeda (2005); the linear fit gives a slope coefficient as indicated in the plot. |
The corrected luminosities also affect the derived initial-mass function (Fig. 9), which now is slightly flatter with a power-law exponent γ = −0.94 ± 0.34.
A sign error is also contained in Eq. (3), where the term BCK should appear with a plus sign. Since we used the correct formula for our calculations, this typo has no further consequences.
The main conclusions of the original paper remain unaffected.
References
- Girardi, L., Bertelli, G., Bressan, A., et al. 2002, A&A, 391, 195 [NASA ADS] [CrossRef] [EDP Sciences] [Google Scholar]
- Lejeune, T., & Schaerer, D. 2001, A&A, 366, 538 [NASA ADS] [CrossRef] [EDP Sciences] [Google Scholar]
- Liermann, A., Hamann, W.-R., & Oskinova, L. M. 2012, A&A, 540, A14 [NASA ADS] [CrossRef] [EDP Sciences] [Google Scholar]
- Maíz Apellániz, J., & Úbeda, L. 2005, ApJ, 629, 873 [NASA ADS] [CrossRef] [Google Scholar]
- Meynet, G., & Maeder, A. 2003, A&A, 404, 975 [NASA ADS] [CrossRef] [EDP Sciences] [Google Scholar]
© ESO, 2014
All Figures
|
Fig. 4 Hertzsprung-Russell diagram of the Quintuplet. Circles (blue) represent the early-type OB stars, triangles (red) the late-type KM stars, filled symbols refer to stars of the corrected sample (see text). The ZAMS and stellar evolution tracks with rotation (solid lines) and without rotation (dashed lines) for different initial masses are from Meynet & Maeder (2003). |
| In the text | |
|
Fig. 5 Same as Fig. 4 but with theoretical isochrones for different cluster ages. The isochrones, shown with alternating line styles, were constructed by Lejeune & Schaerer (2001). The majority of the population of OB stars in the Quintuplet falls between the 2 and 4 Myr isochrones, while most KM stars would need more than 30 Myr to evolve |
| In the text | |
|
Fig. 6 Same as Fig. 5 but with theoretical isochrones based on Girardi et al. (2002). Again, the majority of OB stars falls between the 2 and 4 Myr isochrones, while most KM stars evolve on timescales with more than 30 Myr. |
| In the text | |
|
Fig. 9 IMF for the early-type OB stars in the corrected sample of the LHO catalog plus the WN stars. The distribution shown has variable mass range bins with a constant number of stars per bin to avoid numerical biases according to Maíz Apellániz & Úbeda (2005); the linear fit gives a slope coefficient as indicated in the plot. |
| In the text | |
Current usage metrics show cumulative count of Article Views (full-text article views including HTML views, PDF and ePub downloads, according to the available data) and Abstracts Views on Vision4Press platform.
Data correspond to usage on the plateform after 2015. The current usage metrics is available 48-96 hours after online publication and is updated daily on week days.
Initial download of the metrics may take a while.