Fig. 8
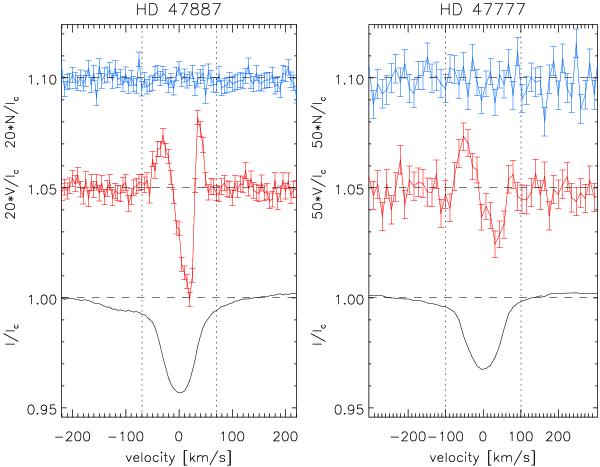
I, V, and N LSD profiles (from bottom to top) obtained for HD 47887 (left panel) and HD 47777 (right panel). The V and N profiles were expanded by a factor of 20 for HD 47887 and 50 for HD 47777, and were shifted upwards for visualisation purposes. All profiles were shifted to the rest frame. The vertical dotted lines indicate the ranges adopted to calculate the magnetic field.
Current usage metrics show cumulative count of Article Views (full-text article views including HTML views, PDF and ePub downloads, according to the available data) and Abstracts Views on Vision4Press platform.
Data correspond to usage on the plateform after 2015. The current usage metrics is available 48-96 hours after online publication and is updated daily on week days.
Initial download of the metrics may take a while.