Free Access
Fig. 4
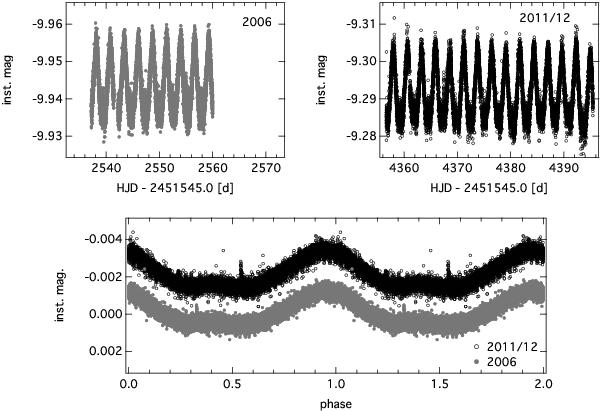
MOST light curve and phase plot for HD 47777: the 2006 data set (grey dots, top-left panel), the 2011/12 data set (black circles, top-right panel), phase plot with a period of 2.641 days (bottom panel). Note that the 2011/12 data set was shifted for clarity.
Current usage metrics show cumulative count of Article Views (full-text article views including HTML views, PDF and ePub downloads, according to the available data) and Abstracts Views on Vision4Press platform.
Data correspond to usage on the plateform after 2015. The current usage metrics is available 48-96 hours after online publication and is updated daily on week days.
Initial download of the metrics may take a while.