Fig. 9
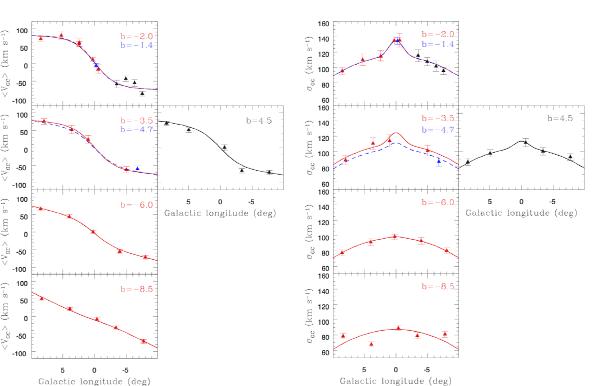
Mean radial velocity (two leftmost panels) or velocity dispersion (two rightmost panels) values as a function of longitude, at a fixed latitude, compared to a surface cut at the same latitude. Data for a given latitude are shown with the same color of the curve at that latitude. Black dots were not included in the fits, for the reasons explained in Sect. 4.2. Points at b = +4.5 are shown here together with the curve at |b| = 4.5 in order to verify the assumption of symmetry about the Galactic plane.
Current usage metrics show cumulative count of Article Views (full-text article views including HTML views, PDF and ePub downloads, according to the available data) and Abstracts Views on Vision4Press platform.
Data correspond to usage on the plateform after 2015. The current usage metrics is available 48-96 hours after online publication and is updated daily on week days.
Initial download of the metrics may take a while.