Free Access
Fig. 2
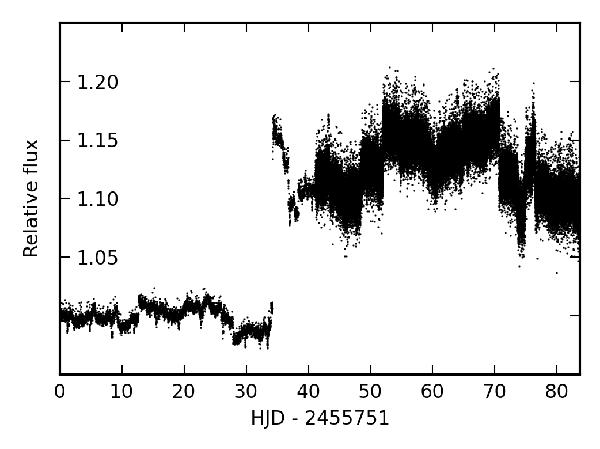
CoRoT-observed white light curve showing the long and short time cadence photometric data with extreme outliers (as marked by the CoRoT photometric pipeline) removed. The individual transits are visible by eye in the cl data.
Current usage metrics show cumulative count of Article Views (full-text article views including HTML views, PDF and ePub downloads, according to the available data) and Abstracts Views on Vision4Press platform.
Data correspond to usage on the plateform after 2015. The current usage metrics is available 48-96 hours after online publication and is updated daily on week days.
Initial download of the metrics may take a while.