Fig. 3
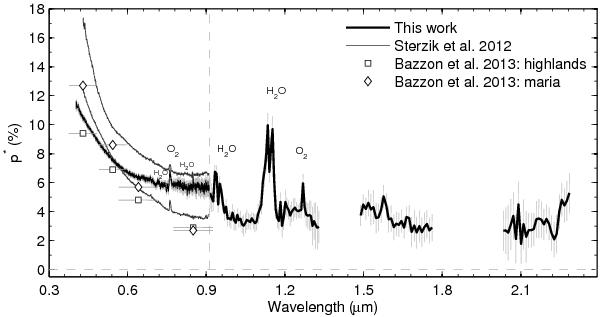
Our visible and NIR spectropolarimetric measurements of the earthshine compared to literature data. A 10-pixel binning was applied to the NIR spectrum of region B. The uncertainty per wavelength is plotted as vertical gray error bars. Wavelengths of strong telluric absorption have been removed. Some molecular species seen in “emission” (indicative of strong atmospheric flux absorption and less multiscattering processes occurring at those particular wavelengths) are labeled. The vertical dashed line separates the ALFOSC and LIRIS data.
Current usage metrics show cumulative count of Article Views (full-text article views including HTML views, PDF and ePub downloads, according to the available data) and Abstracts Views on Vision4Press platform.
Data correspond to usage on the plateform after 2015. The current usage metrics is available 48-96 hours after online publication and is updated daily on week days.
Initial download of the metrics may take a while.