Fig. 11
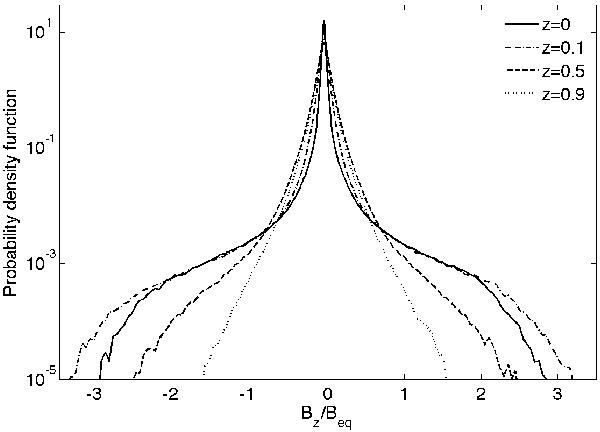
Time-averaged probability density function for the vertical component of the magnetic field at 4 different depths for the statistically-steady, nonlinear dynamo calculation that is illustrated in Fig. 10. The different curves correspond to z = 0 (solid line), z = 0.1 (dash-dotted line), z = 0.5 (dashed line) and z = 0.9 (dotted line). At each depth, the magnetic field has been normalised by the local equipartition field strength, Beq.
Current usage metrics show cumulative count of Article Views (full-text article views including HTML views, PDF and ePub downloads, according to the available data) and Abstracts Views on Vision4Press platform.
Data correspond to usage on the plateform after 2015. The current usage metrics is available 48-96 hours after online publication and is updated daily on week days.
Initial download of the metrics may take a while.