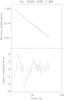
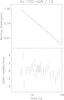
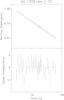
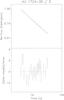
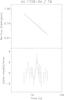
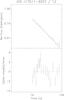
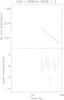
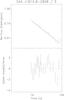
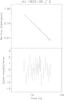
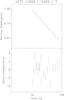
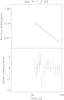
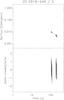
Fig. 4
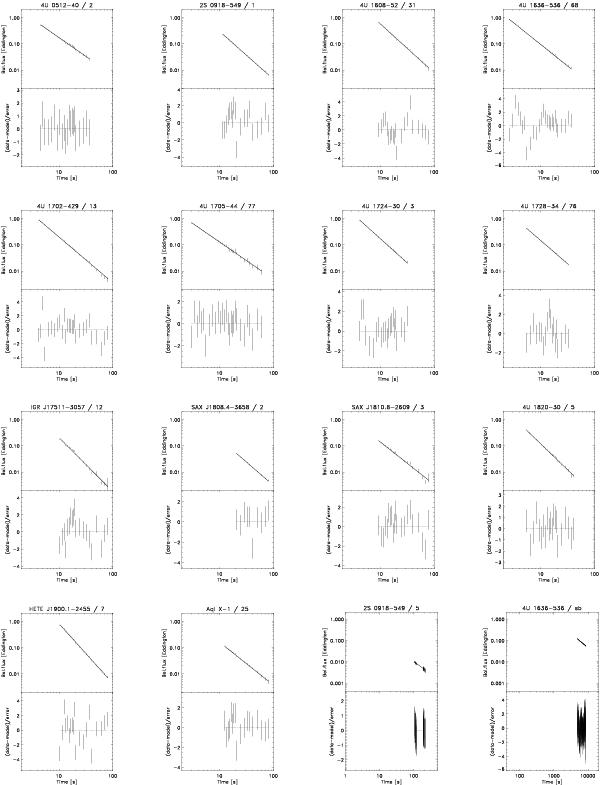
Power-law fits to bolometric flux histories of 16 representative bursts from 14 different LMXBs. The X-axis represents time since burst onset. There are two panels per burst. Upper panels: bolometric flux in units of the Eddington flux, as determined from the highest peak flux over all bursts observed per source. Lower panels: deviation with respect to the model in units of σ per data point. All axes of the upper panels and time have an identical dynamic ranges so that slopes can be directly compared. The two axes of all upper panels have the same ratio in dynamic range, so that slopes can be directly compared among different panels. Bursts are identified in the heading of each panel in the same manner as in Table 1.
Current usage metrics show cumulative count of Article Views (full-text article views including HTML views, PDF and ePub downloads, according to the available data) and Abstracts Views on Vision4Press platform.
Data correspond to usage on the plateform after 2015. The current usage metrics is available 48-96 hours after online publication and is updated daily on week days.
Initial download of the metrics may take a while.