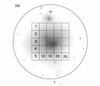
Fig. 5
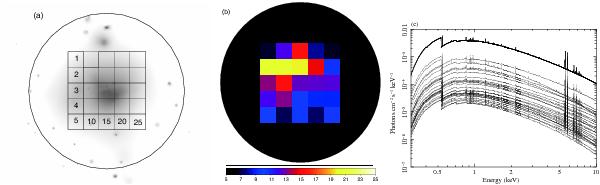
Multi-temperature model derived from the XMM-Newton data. a) Definition of spectral regions used to construct the multi-temperature model, b) temperature map obtained from the XMM-Newton spectral analysis, c) and best-fit multi-temperature model. Panel a) shows the central 25 grids (1 grid = 2′ × 2′) and the surrounding region within a circle of r = 10′. In panel b), the color scale indicates the gas temperature in keV, ranging from 5 (navy) to 25 (white). Panel c) shows the total model (solid line) as well as the APEC models for the 26 spectral regions within r < 10′ (the dashed lines).
Current usage metrics show cumulative count of Article Views (full-text article views including HTML views, PDF and ePub downloads, according to the available data) and Abstracts Views on Vision4Press platform.
Data correspond to usage on the plateform after 2015. The current usage metrics is available 48-96 hours after online publication and is updated daily on week days.
Initial download of the metrics may take a while.