Fig. 4
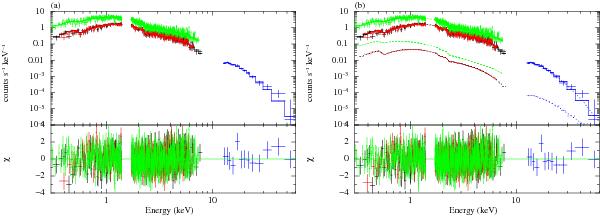
XMM and HXD spectra of A2163 in the 0.3–60 keV band fitted by a) the APEC model and b) the APEC and power-law model. The EMOS1/EMOS2/EPN data are shown by the black/red/green crosses; the blue crosses denote HXD data. Solid lines indicate the best-fit models for each instrument. In panel b), the power-law component is also indicated by the dotted line.

Current usage metrics show cumulative count of Article Views (full-text article views including HTML views, PDF and ePub downloads, according to the available data) and Abstracts Views on Vision4Press platform.
Data correspond to usage on the plateform after 2015. The current usage metrics is available 48-96 hours after online publication and is updated daily on week days.
Initial download of the metrics may take a while.