Fig. 2
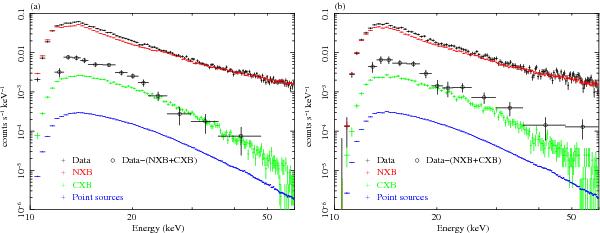
HXD spectra of A2163 in the 10–60 keV band for the central region a) and the northeast region b). In each panel, observed HXD data denoted as “Data”, the NXB model, the CXB model, and the background-subtracted data, “Data – (NXB+CXB)”, are shown using black crosses, red crosses, green crosses, and black circles, respectively. The point-source contribution estimated from the XMM-Newton observations of the same field is shown using blue crosses.
Current usage metrics show cumulative count of Article Views (full-text article views including HTML views, PDF and ePub downloads, according to the available data) and Abstracts Views on Vision4Press platform.
Data correspond to usage on the plateform after 2015. The current usage metrics is available 48-96 hours after online publication and is updated daily on week days.
Initial download of the metrics may take a while.