Free Access
Fig. 1
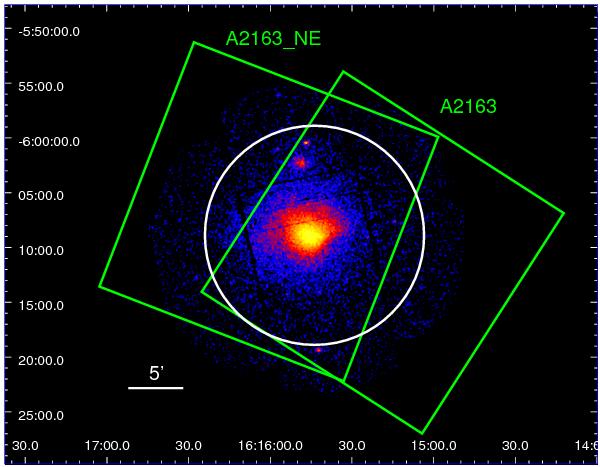
XMM-Newton EMOS image of A2163 in the 0.2–10 keV band. The boxes indicate the HXD-PIN field of views during two pointed observations. The white circle delineates the XMM-Newton spectral region of cluster emission (r < 10′).
Current usage metrics show cumulative count of Article Views (full-text article views including HTML views, PDF and ePub downloads, according to the available data) and Abstracts Views on Vision4Press platform.
Data correspond to usage on the plateform after 2015. The current usage metrics is available 48-96 hours after online publication and is updated daily on week days.
Initial download of the metrics may take a while.