Free Access
Fig. 8
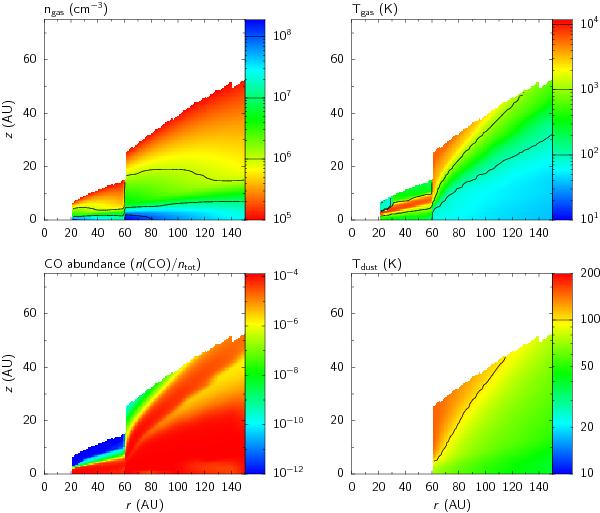
Density structure, gas and dust temperatures, and CO fractional abundance of the representative model (Table 3). Only regions with gas density higher than 105 cm-3 are shown. The dust temperature is not defined in the dust-free cavity. The z-axis is stretched by a factor of two compared to the r-axis.
Current usage metrics show cumulative count of Article Views (full-text article views including HTML views, PDF and ePub downloads, according to the available data) and Abstracts Views on Vision4Press platform.
Data correspond to usage on the plateform after 2015. The current usage metrics is available 48-96 hours after online publication and is updated daily on week days.
Initial download of the metrics may take a while.