Fig. 4
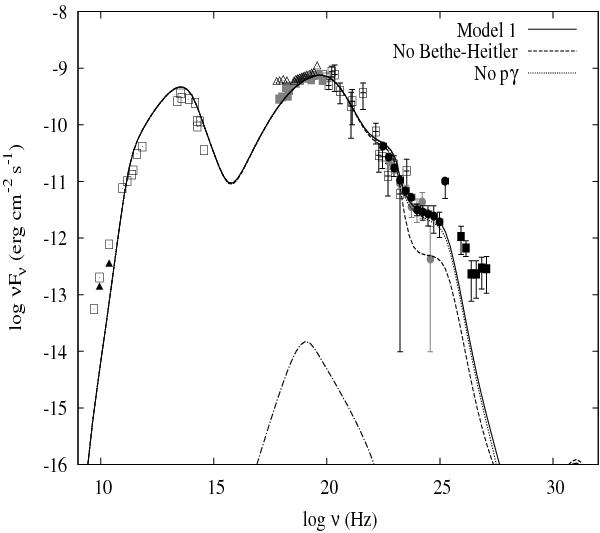
Contribution of the photohadronic processes to the high-energy part of the spectrum. Our model spectra when all processes are included are shown with a solid line; when photopair and photopion processes are seperately neglected, spectra are shown with dashed and dotted lines, respectively. The dash-dotted curve corresponds to the proton synchrotron emission. For the parameters used see Model 1 in Table 3.
Current usage metrics show cumulative count of Article Views (full-text article views including HTML views, PDF and ePub downloads, according to the available data) and Abstracts Views on Vision4Press platform.
Data correspond to usage on the plateform after 2015. The current usage metrics is available 48-96 hours after online publication and is updated daily on week days.
Initial download of the metrics may take a while.