Fig. 2
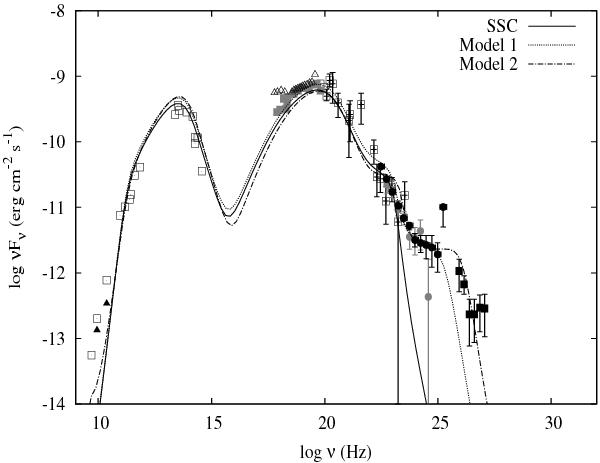
Leptohadronic fit of the MW core emission of Cen A using the parameter sets shown in Table 3. Models 1 and 2 are shown with dotted and dashed-dotted lines, respectively. For comparison, the one-zone SSC fit shown in Fig. 1 is overplotted with a solid line. All other symbols are the same as in Fig. 1.
Current usage metrics show cumulative count of Article Views (full-text article views including HTML views, PDF and ePub downloads, according to the available data) and Abstracts Views on Vision4Press platform.
Data correspond to usage on the plateform after 2015. The current usage metrics is available 48-96 hours after online publication and is updated daily on week days.
Initial download of the metrics may take a while.