Fig. 2
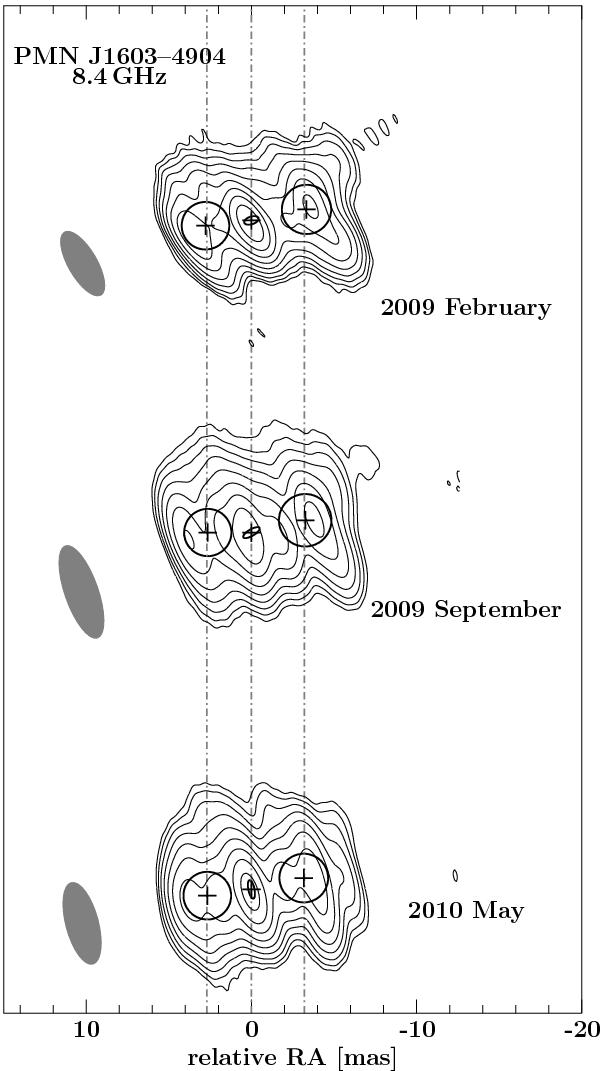
Time evolution of PMN J1603−4904. CLEAN images of the first 8.4 GHz TANAMI observations are shown. The contours indicate the flux density level, scaled logarithmically and separated by a factor of 2, with the lowest level set to the 3σ-noise-level (for more details see Table 1). The positions and FWHMs of the Gaussian emission components are overlaid as black ellipses (for model parameters see Table 2). From top to bottom: 2009 February (combined image of the 23rd and 27th), 2009 September, and 2010 May. The size of the restoring beams for each individual observation is shown as a gray ellipse on the left. Vertical dashed lines which indicate the relative positions of the eastern and western features with respect to the central component are drawn at 2.7 mas and −3.2 mas, respectively.
Current usage metrics show cumulative count of Article Views (full-text article views including HTML views, PDF and ePub downloads, according to the available data) and Abstracts Views on Vision4Press platform.
Data correspond to usage on the plateform after 2015. The current usage metrics is available 48-96 hours after online publication and is updated daily on week days.
Initial download of the metrics may take a while.