Free Access
Fig. 2
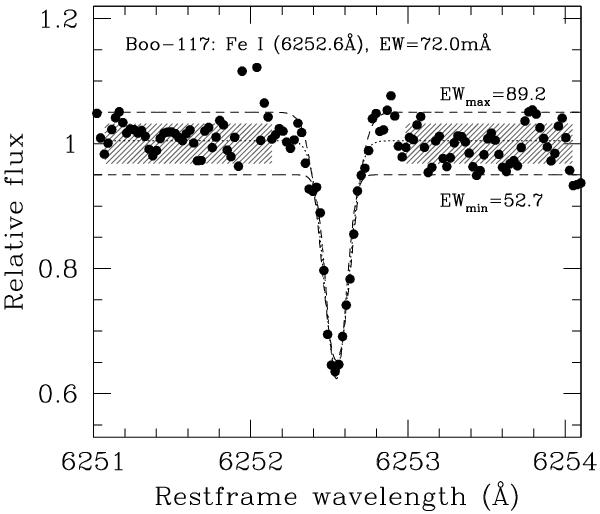
EW measurements for one of the Fe I lines by adopting the different continuum levels. The dotted line shows the best-fit Gaussian, where continuum level is estimated from the shaded wavelengths region. The dashed lines show the Gaussian fit by fixing the continuum levels to be ± 0.05 of the best-fit value.
Current usage metrics show cumulative count of Article Views (full-text article views including HTML views, PDF and ePub downloads, according to the available data) and Abstracts Views on Vision4Press platform.
Data correspond to usage on the plateform after 2015. The current usage metrics is available 48-96 hours after online publication and is updated daily on week days.
Initial download of the metrics may take a while.