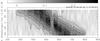
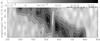
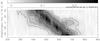
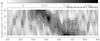
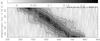
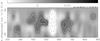
Fig. 4

Position-velocity maps of molecular line emission from the central region of Centaurus A, in position angle 125° counter-clockwise from north (data summarised in Tables 2 and 3). Horizontal scales are velocity V(LSR) in km s-1, vertical scales are offsets from the nucleus in arcsec. The panels on the left show emission from 12CO; the J = 1–0, J = 2–1, and J = 3–2 transitions are shown from top to bottom, respectively. The panels on the right show emission from 13CO (J = 1–0 at the top, J = 2–1 in the middle). The J = 1–0 HCN transition is at bottom right. The J = 1–0 maps have resolutions of 45′′−55′′, all other maps have an effective resolution of 23′′. In all three 12CO maps, the contours are at multiples of 50 mK in main-beam brightness temperature. In the 13CO maps contours are at multiples of 5 mK (J = 1–0) and 10 mK (J = 2–1). The HCN map contours are at multiples of 5 mK. Strong absorption is clear in all panels near VLSR = 550 km s-1. Emission from the rapidly rotating compact nuclear disk becomes progressively more clear with increasing J-transition in the 12COpanels, and in the HCN map.
Current usage metrics show cumulative count of Article Views (full-text article views including HTML views, PDF and ePub downloads, according to the available data) and Abstracts Views on Vision4Press platform.
Data correspond to usage on the plateform after 2015. The current usage metrics is available 48-96 hours after online publication and is updated daily on week days.
Initial download of the metrics may take a while.