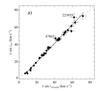
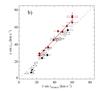
Fig. 5

Comparison of the different vsini determinations given in Table 1, excluding SB2 stars. a) The vsini derived from the first zero of the FT is compared to the one derived from the spectral synthesis (SYNTH). The linear fit is shown by the thick solid line. The two stars with the largest differences are labeled. b) The vsini derived from the first zero of the FT is compared to the homogenized merged catalog from Royer et al. (2002b, RGBGZ). The different symbols stand from the source of the data in the latter: filled squares were from Abt & Morrell (1995, AM), filled circles were derived by RGBGZ using Fourier analysis, open circles are a combination of both sources. The linear fit on the subsample with data from AM is represented by the thick solid line. In both panels, the one-to-one relation is represented by the dashed line.
Current usage metrics show cumulative count of Article Views (full-text article views including HTML views, PDF and ePub downloads, according to the available data) and Abstracts Views on Vision4Press platform.
Data correspond to usage on the plateform after 2015. The current usage metrics is available 48-96 hours after online publication and is updated daily on week days.
Initial download of the metrics may take a while.