Fig. 3
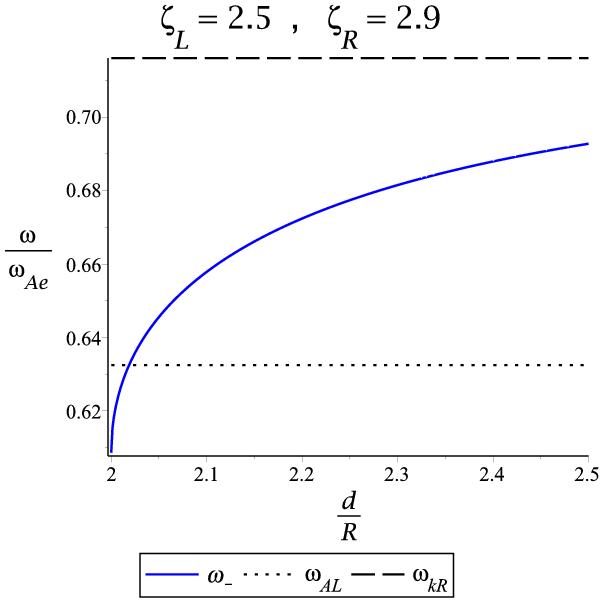
Plot of the lower eigenfrequency ω− (full line) as a function of tube separation d/R, together with the Alfvén frequency of the left tube (dotted line), marking the transition point between standard and anomalous systems, and the kink frequency of the right tube (dashed line).
Current usage metrics show cumulative count of Article Views (full-text article views including HTML views, PDF and ePub downloads, according to the available data) and Abstracts Views on Vision4Press platform.
Data correspond to usage on the plateform after 2015. The current usage metrics is available 48-96 hours after online publication and is updated daily on week days.
Initial download of the metrics may take a while.