Fig. 4
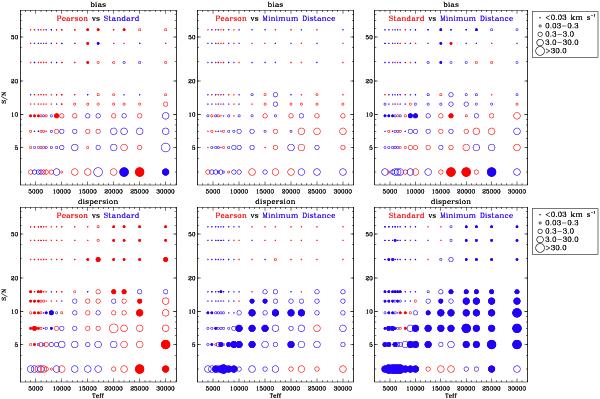
Pairwise comparison of the bias (top panels) and the dispersion (bottom panels) between three different methods as indicated in each panel. The results are plotted as a function of effective temperature (x-axis) and signal-to-noise ratio (y-axis). The colours are identified with the method names in each panel; each point is given the colour of the method with the smallest bias (top row) or the smallest dispersion (bottom row) respectively. Filled symbols indicate that the difference is statistically significant at the 0.2% level in a two-sided test.
Current usage metrics show cumulative count of Article Views (full-text article views including HTML views, PDF and ePub downloads, according to the available data) and Abstracts Views on Vision4Press platform.
Data correspond to usage on the plateform after 2015. The current usage metrics is available 48-96 hours after online publication and is updated daily on week days.
Initial download of the metrics may take a while.