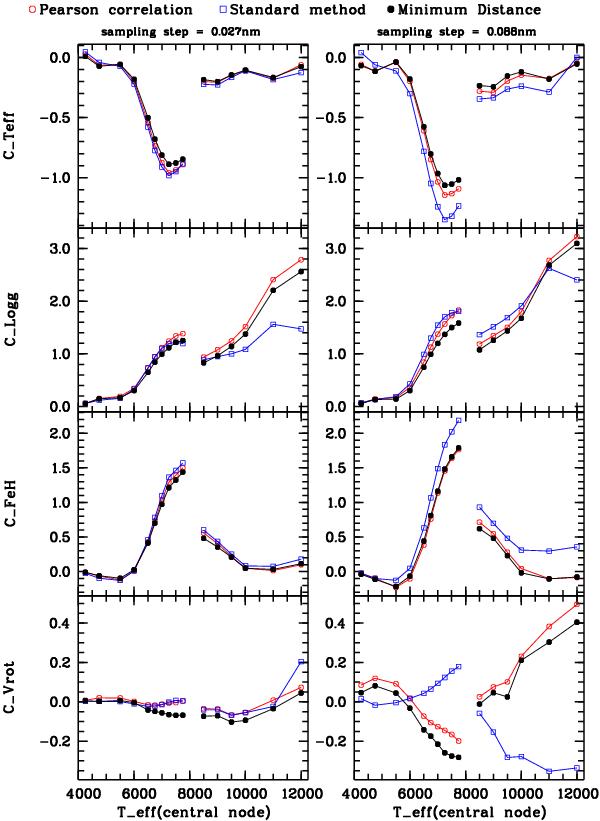
Fig. 2

First-order coefficients in Eq. (15) for a set of central nodes with log g = 4, [Fe/H] = 0, and vsini = 20, but with different Teff-values as indicated on the x-axis. The y-axis labels identify the deviating AP in each frame. The ordinate values represent the TME-contribution (in km s-1) of this AP if it deviates by one step (see Eq. (14)) from the central node. The run of the coefficients is given for slightly oversampled (left frame) and slightly undersampled (right frame) spectra with an instrumental resolution of 11 500, and for the three measurement methods as indicated on top. The gap at 8000 K is due to the fact that different atmospheric models were used for temperatures above and below this value; incidentally it illustrates the sensitivity of Doppler-shift measurements to the templates used.
Current usage metrics show cumulative count of Article Views (full-text article views including HTML views, PDF and ePub downloads, according to the available data) and Abstracts Views on Vision4Press platform.
Data correspond to usage on the plateform after 2015. The current usage metrics is available 48-96 hours after online publication and is updated daily on week days.
Initial download of the metrics may take a while.


