Fig. A.3
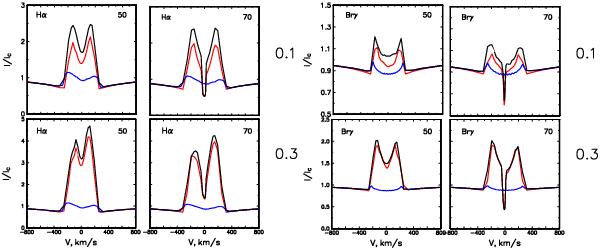
Hα and Brγ line profiles in the hybrid model MS + disk wind (model A4). Profiles are given for the Ṁw/Ṁacc ratio 0.1 and 0.3 (marked on the right). The profiles formed by the magnetosphere (blue line), the disk wind (red line), and by both regions (hybrid model; black line) are shown. The inclination angles are shown in the panel. Ṁacc = 1 × 10⁻⁸ M⊙ yr-1.
Current usage metrics show cumulative count of Article Views (full-text article views including HTML views, PDF and ePub downloads, according to the available data) and Abstracts Views on Vision4Press platform.
Data correspond to usage on the plateform after 2015. The current usage metrics is available 48-96 hours after online publication and is updated daily on week days.
Initial download of the metrics may take a while.