Fig. 6
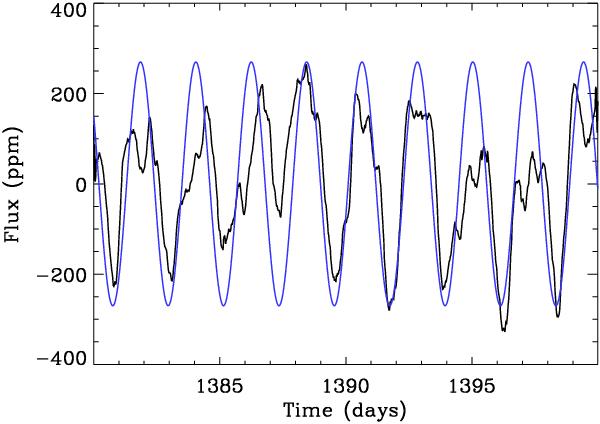
Light curve of KIC 3733735 at a maximum of the amplitude (black). The blue line is a sine wave whose frequency corresponds to the maximum of the light curve spectrum. The truncated upper parts of the real light curve are clearly visible while the lower parts are very similar to the pure sine wave. This shape is characteristic of starspots with surface rotation.
Current usage metrics show cumulative count of Article Views (full-text article views including HTML views, PDF and ePub downloads, according to the available data) and Abstracts Views on Vision4Press platform.
Data correspond to usage on the plateform after 2015. The current usage metrics is available 48-96 hours after online publication and is updated daily on week days.
Initial download of the metrics may take a while.