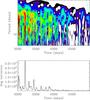
Fig. 5
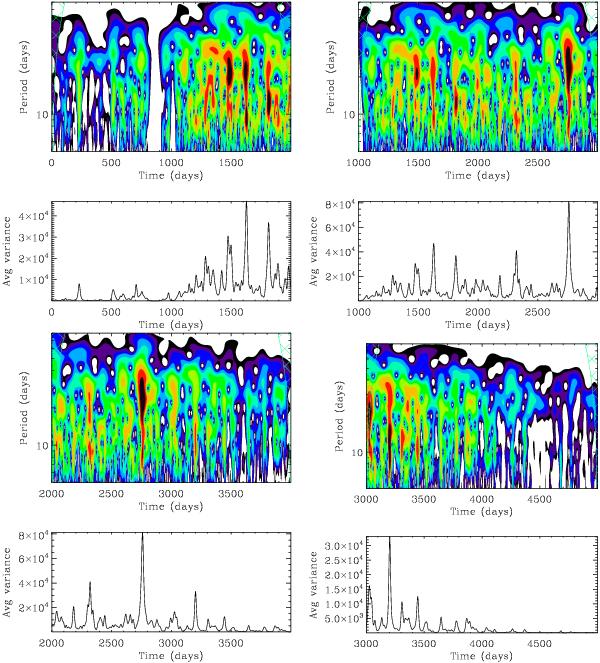
Wavelet analysis of VIRGO data for subseries of 2000 days. For each subseries, we show the wavelet power spectrum (red and dark areas are correspond to high power) and the average variance that is the magnetic proxy obtained by projecting the WPS between 6- and 60-day periods on the x-axis. Plots from top left to bottom right correspond to the increase in cycle 23 to the decrease in cycle 23.
Current usage metrics show cumulative count of Article Views (full-text article views including HTML views, PDF and ePub downloads, according to the available data) and Abstracts Views on Vision4Press platform.
Data correspond to usage on the plateform after 2015. The current usage metrics is available 48-96 hours after online publication and is updated daily on week days.
Initial download of the metrics may take a while.