Fig. 1
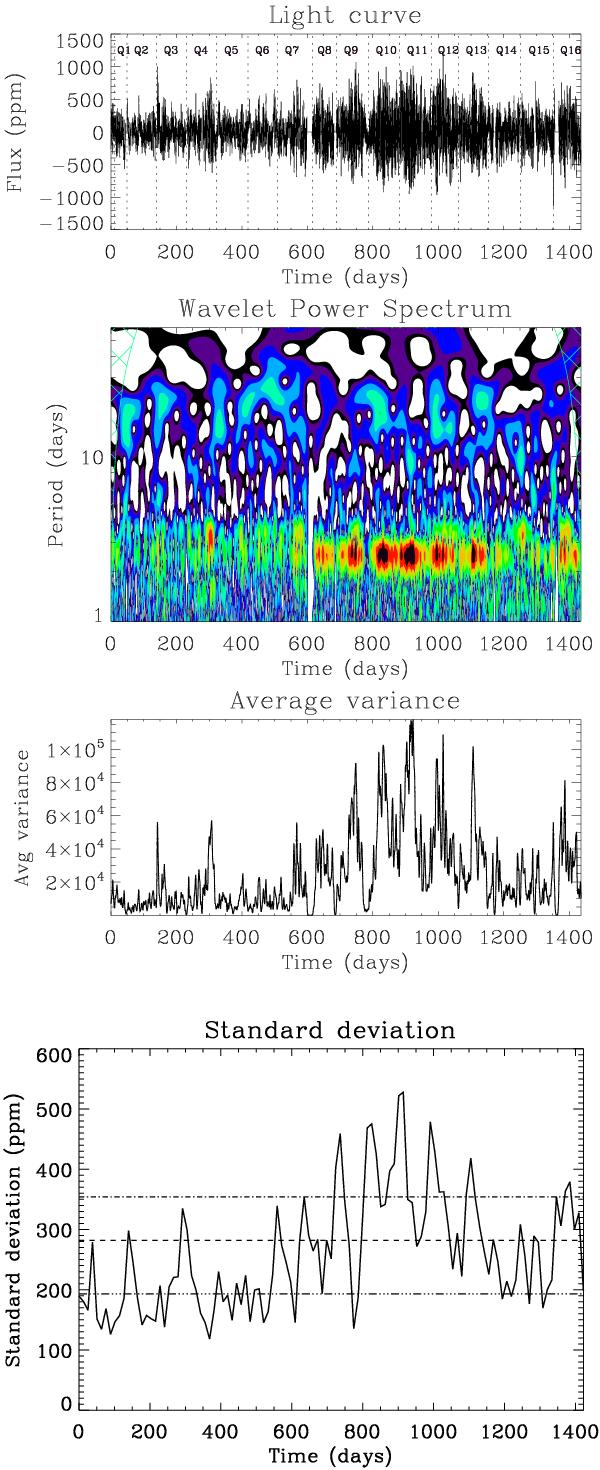
Wavelet analysis of KIC 3733735 (groups C and L). Top panel: temporal variation of the flux after the corrections applied as in García et al. (2011) and rebinned to 2 h. Middle panel: wavelet power spectrum as a function of time and period. The green grid represents the cone of influence that takes into account the edge effects and delimits the reliable rein in the WPS. Red and dark colours correspond to strong power while blue corresponds to weak power. Bottom upper panel: projection of the WPS on the time axis between periods of 1 and 4.1 days. Bottom lower panel: temporal variation of the standard deviation for KIC 3733735 for subseries of length 5 × Prot. The black dashed line represents the mean value of the standard deviation of the subseries, i.e. the magnetic index ⟨ Sph ⟩. The triple dot-dashed line represents the mean magnetic index for the low-activity subseries (⟨ Sph(nlow) ⟩) and the dash-dot line corresponds to the mean magnetic index for the high-activity subseries ⟨ Sph(nhigh) ⟩.
Current usage metrics show cumulative count of Article Views (full-text article views including HTML views, PDF and ePub downloads, according to the available data) and Abstracts Views on Vision4Press platform.
Data correspond to usage on the plateform after 2015. The current usage metrics is available 48-96 hours after online publication and is updated daily on week days.
Initial download of the metrics may take a while.