Fig. 6
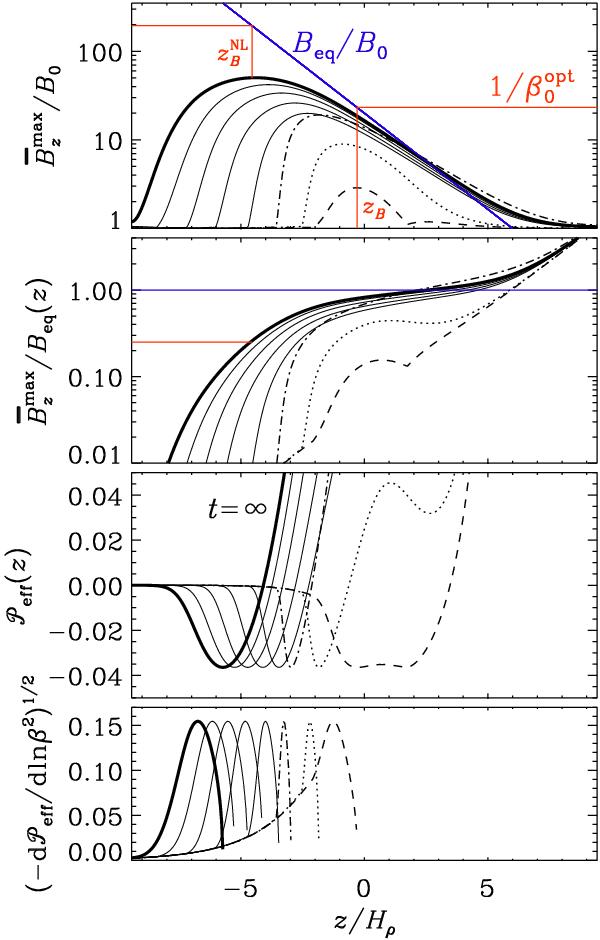
Time evolution of normalized vertical magnetic field profiles, a) together with Beq(z)/B0 (shown by blue line), b)
 ; as well as c)
  and d)
  , from a MFS for Run Bv05/33 with B0/Beq0 = 0.05 at t/τtd = 2.9 (dashed), 3 (dotted), 3.1 (dash-dotted), 3.3, 3.7, 4.2., 5, and 50 (thick solid line). The blue solid lines indicate Beq(z), normalized by a) B0 and b) by itself (corresponding thus to unity). The red lines indicate the locations zB and
  , as well as relevant intersections with normalized values of
  and Beq.
Current usage metrics show cumulative count of Article Views (full-text article views including HTML views, PDF and ePub downloads, according to the available data) and Abstracts Views on Vision4Press platform.
Data correspond to usage on the plateform after 2015. The current usage metrics is available 48-96 hours after online publication and is updated daily on week days.
Initial download of the metrics may take a while.