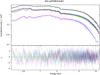
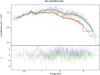
Fig. 4

Left panel: the EPIC spectra of 4U1700+24 during the four observations analysed in this work. Black, green, blue, and red data points correspond to the EPIC pn data of the observations 0155960601, 0151240301, 0151240201, and 0151240401, respectively. Since the pile-up affected most of the data sets, MOS 1 and MOS 2 data (purple and cyan data points) were only available for the last observation (i.e. 0151240401). Here, the solid lines correspond to the best-fit model described in the text. Right panel: the Swift/XRT spectra of 4U1700+24 during the 2010 and 2012 observations (data points) together with the best-fit model (solid lines). Here, the black and red data correspond to the Swift observations 0009080001 and 0009080002, respectively while the other data sets shown (purple, blue, yellow, green and cyan) correspond to the observation IDs from 0054025500 to 0054025504 of Table 4.
Current usage metrics show cumulative count of Article Views (full-text article views including HTML views, PDF and ePub downloads, according to the available data) and Abstracts Views on Vision4Press platform.
Data correspond to usage on the plateform after 2015. The current usage metrics is available 48-96 hours after online publication and is updated daily on week days.
Initial download of the metrics may take a while.