Fig. 7
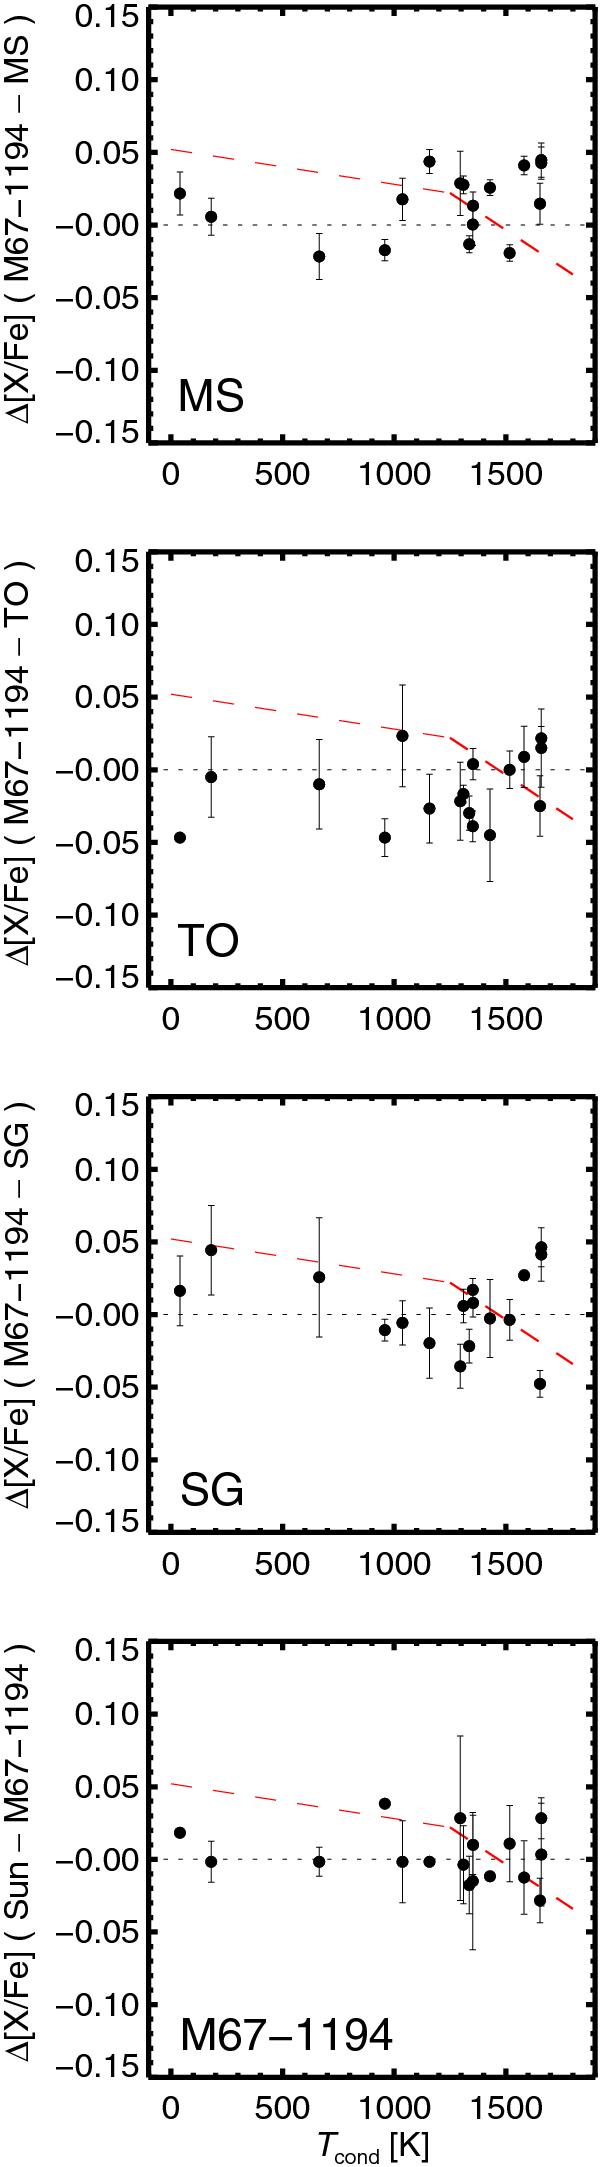
Abundance differences (M 67-1194 − group mean) where the means are taken for stars in the different groups, Main-sequence stars, Turn-off point stars and Subgiant stars, respectively. The solar-twin line of Meléndez et al. (2009) is indicated (red dashed). The panel in the bottom displays the differences Sun − M 67-1194. Error bars in the upper three panels represent the RMS errors in the group means (σ/ ). In the bottom panel the error bars represent line-to-line scatter.
Current usage metrics show cumulative count of Article Views (full-text article views including HTML views, PDF and ePub downloads, according to the available data) and Abstracts Views on Vision4Press platform.
Data correspond to usage on the plateform after 2015. The current usage metrics is available 48-96 hours after online publication and is updated daily on week days.
Initial download of the metrics may take a while.