Fig. 6
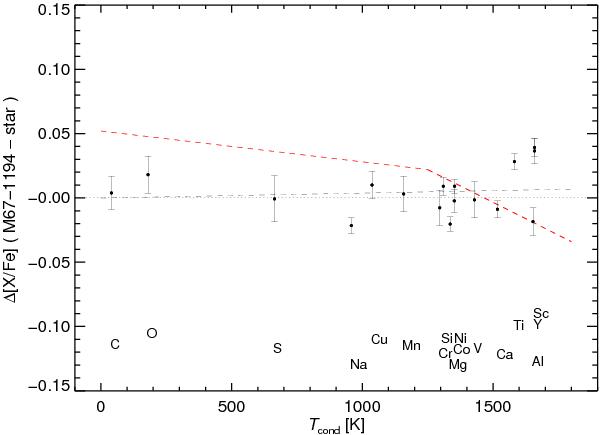
Differences in logarithmic abundances between M 67-1194 and the means for the other 13 programme stars of the present study, plotted vs. the condensation temperature of the elements (Lodders 2003). The red dashed line indicates the rough mean locus of the solar-solar twin abundances, according to Meléndez et al. (2009). The grey dashed line is a regression line to the data. Error bars represent the RMS errors in the means for the entire sample (σ/ ).
).
Current usage metrics show cumulative count of Article Views (full-text article views including HTML views, PDF and ePub downloads, according to the available data) and Abstracts Views on Vision4Press platform.
Data correspond to usage on the plateform after 2015. The current usage metrics is available 48-96 hours after online publication and is updated daily on week days.
Initial download of the metrics may take a while.