Free Access
Fig. 4
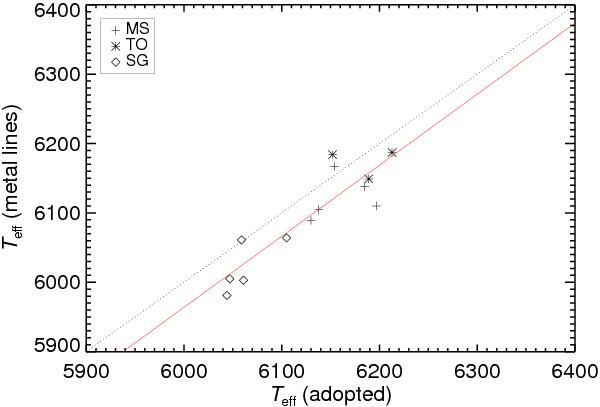
Mean of the temperature estimates from ionisation equilibria (Fe and Ti, respectively), excitation equilibria and relative line depths of metal lines, vs. the adopted effective temperatures. The 1−1 line (dots) and a regression line (red) are drawn. Symbols for different stellar groups are indicated.
Current usage metrics show cumulative count of Article Views (full-text article views including HTML views, PDF and ePub downloads, according to the available data) and Abstracts Views on Vision4Press platform.
Data correspond to usage on the plateform after 2015. The current usage metrics is available 48-96 hours after online publication and is updated daily on week days.
Initial download of the metrics may take a while.