Free Access
Fig. 2
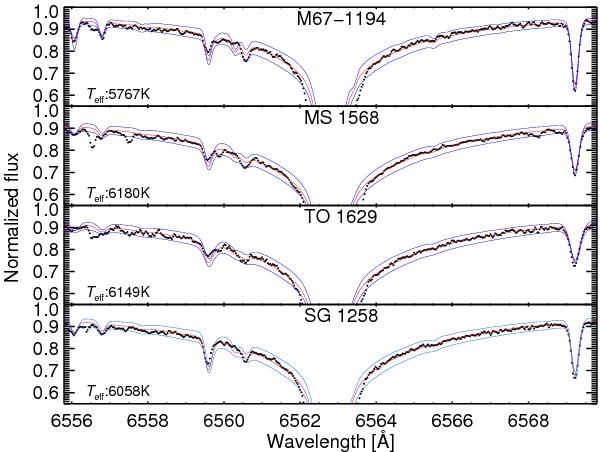
Fits of the Hα wing profiles of four representative stars. The red lines show spectra of best fit models. Blue lines show the effects of temperature shifts by ± 100 K. Effective temperatures given in the panels are corrected upwards by 100 K (see text).
Current usage metrics show cumulative count of Article Views (full-text article views including HTML views, PDF and ePub downloads, according to the available data) and Abstracts Views on Vision4Press platform.
Data correspond to usage on the plateform after 2015. The current usage metrics is available 48-96 hours after online publication and is updated daily on week days.
Initial download of the metrics may take a while.