Fig. 7
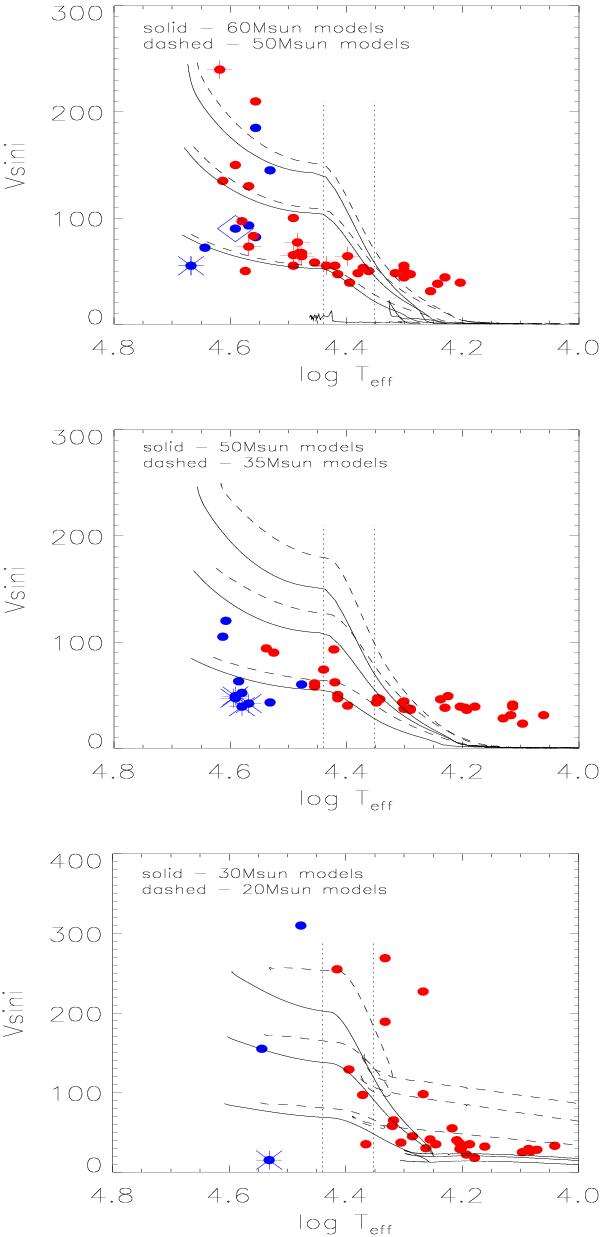
Projected rotation velocities and effective temperatures for the OB supergiants (red) and the O-type giants and dwarfs (blue) from our sample, plotted against evolutionary tracks from Brott et al. (2011). All stars have been binned into three mass ranges: 15 M⊙ ≤ M ≤ 30 M⊙ (bottom panel); 31 M⊙ ≤ M ≤ 50 M⊙ (middle panel), and M ≥ 51 M⊙ (top panel). O-type stars close to the ZAMS with anomalously low vsini are additionally highlighted by asterisks. The large diamond marks HD 93843, which has been recently identified as a magnetic star (Hubrig et al. 2011). In the top panel, the most massive stars ( ≳ 70 M⊙) are marked by crosses. The model values have been scaled by π/4 to account for projection. The two vertical lines represent the temperature limits of the bi-stability jump, as determined by Vink et al. (1999).
Current usage metrics show cumulative count of Article Views (full-text article views including HTML views, PDF and ePub downloads, according to the available data) and Abstracts Views on Vision4Press platform.
Data correspond to usage on the plateform after 2015. The current usage metrics is available 48-96 hours after online publication and is updated daily on week days.
Initial download of the metrics may take a while.