Fig. 6
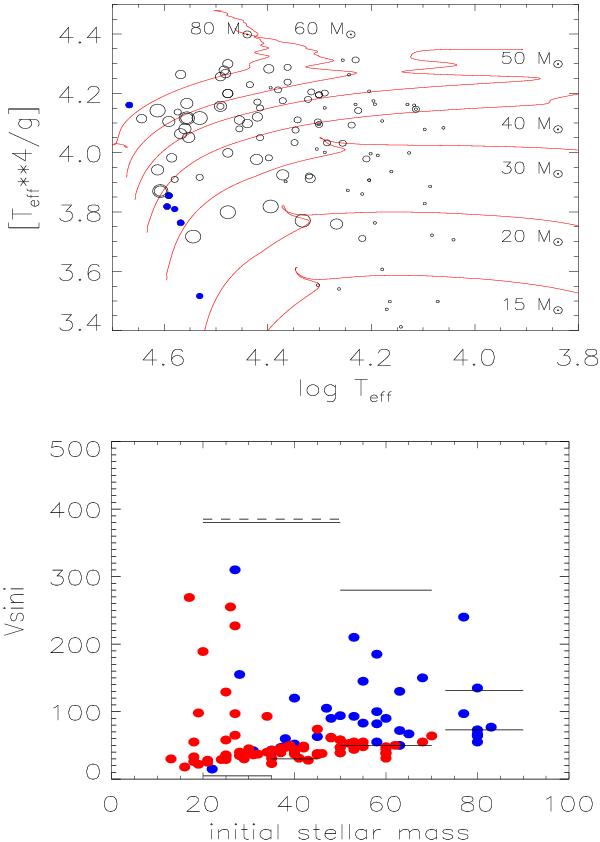
Upper panel: values of  vs. Teff for our OB sample, with
  . Overplotted are the evolutionary tracks from Brott et al. (2011) for vinit ≈ 300 km s-1and seven values of
  . The size of the data points is proportional to the values of vsini. Stars close to the ZAMS with anomalously low vsini are highlighted in blue. Lower panel: projected rotational velocities vs. initial evolutionary masses. O stars are colored in blue, and B-supergiants in red. Horizontal lines represent upper and lower limits to vsini as deduced from Fig. 1 in Wolff et al. (2006) (dashed) and Fig. 5 of Penny (1996) (solid), additionally corrected for by a constant value of −19 km s-1 to account for extra broadening.
Current usage metrics show cumulative count of Article Views (full-text article views including HTML views, PDF and ePub downloads, according to the available data) and Abstracts Views on Vision4Press platform.
Data correspond to usage on the plateform after 2015. The current usage metrics is available 48-96 hours after online publication and is updated daily on week days.
Initial download of the metrics may take a while.