Fig. 4
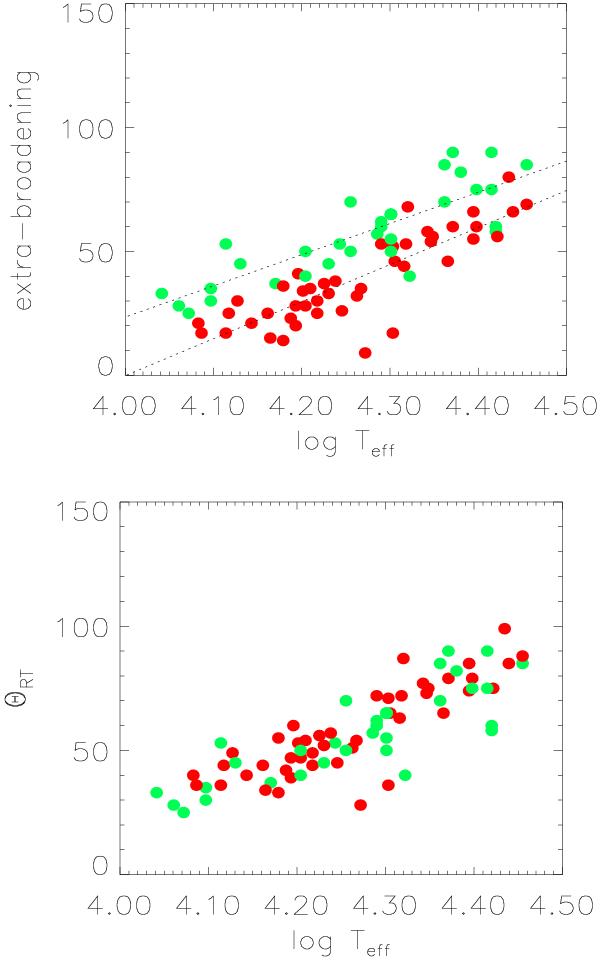
Distribution of extra broadening velocities for the B-supergiants in the OB sample. The data derived by assuming different models for extra broadening are highlighted in different colors: red denotes an isotropic Gaussian model (Fraser et al. 2010), whilst green refers to a radial-tangential one (Lefever et al. 2007; Markova & Puls 2008; Simón-Díaz et al. 2010). Note the systematic shift along the vertical axes between the green and the red dots (upper panel) and that this shift disappears after the original Fraser et al. (2010) data for extra broadening have been corrected to make them consistent with the rest (lower panel). For dotted lines, see Sect. 5.1.
Current usage metrics show cumulative count of Article Views (full-text article views including HTML views, PDF and ePub downloads, according to the available data) and Abstracts Views on Vision4Press platform.
Data correspond to usage on the plateform after 2015. The current usage metrics is available 48-96 hours after online publication and is updated daily on week days.
Initial download of the metrics may take a while.