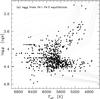
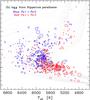
Fig. 9
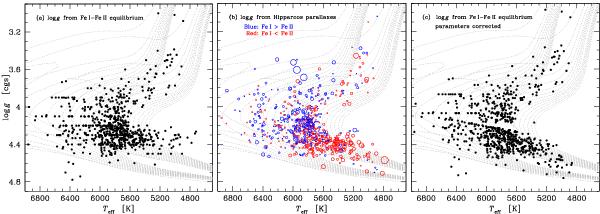
HR diagram for the sample when a) log g is based on Fe i-Fe ii ionisation equilibrium, and b) when log g is based on Hipparcos parallaxes. In b) the sizes of the circles are scaled with the difference between Fe i and Fe ii abundances. Red circles mark those stars where the Fe i abundances are lower than the Fe ii abundances, and vice versa for the blue circles. The α-enhanced Yonsei-Yale (Y2) isochrones by Demarque et al. (2004) have metallicities of [Fe/H] = −1 and + 0.3 dex, respectively, and are shown from 1 to 15 Gyr in steps of 1 Gyr.
Current usage metrics show cumulative count of Article Views (full-text article views including HTML views, PDF and ePub downloads, according to the available data) and Abstracts Views on Vision4Press platform.
Data correspond to usage on the plateform after 2015. The current usage metrics is available 48-96 hours after online publication and is updated daily on week days.
Initial download of the metrics may take a while.