Free Access
Fig. 4
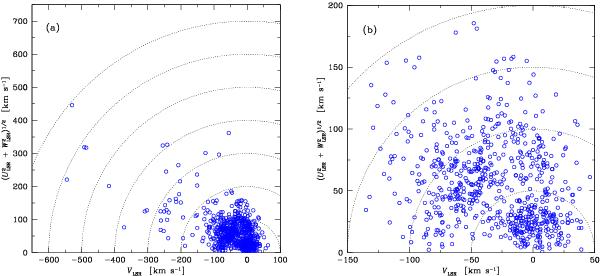
Toomre diagram of our program stars. a) shows the full range of velocities while b) zooms in on the region where a majority of the sample is located. Dotted lines show constant values of the total space velocity, 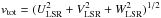 , in steps of 100 km s-1 and 50 km s-1, respectively, in the two plots.
This figure is made of several images, please see below:
Current usage metrics show cumulative count of Article Views (full-text article views including HTML views, PDF and ePub downloads, according to the available data) and Abstracts Views on Vision4Press platform.
Data correspond to usage on the plateform after 2015. The current usage metrics is available 48-96 hours after online publication and is updated daily on week days.
Initial download of the metrics may take a while.