Fig. 30
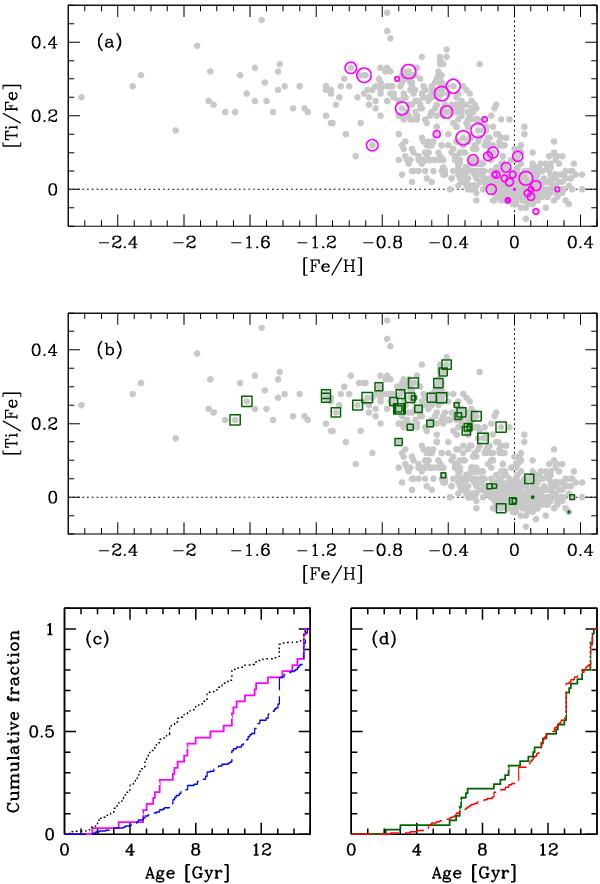
a) and b) show the [Ti/Fe] – [Fe/H] abundance plots for the candidate Hercules stream and Arcturus group stars, respectively. Same markers as in Fig. 29. c) and d) show the cumulative age distributions for the candidate Hercules and Arcturus stars, respectively (coloured as in a) and b)). In c) the dotted black line represents stars with 7 < Rmean < 9 kpc and the dashed blue line stars with Rmean < 7 kpc (compare Fig. 26). In d) the dashed red line represents stars with TD/D > 10.
Current usage metrics show cumulative count of Article Views (full-text article views including HTML views, PDF and ePub downloads, according to the available data) and Abstracts Views on Vision4Press platform.
Data correspond to usage on the plateform after 2015. The current usage metrics is available 48-96 hours after online publication and is updated daily on week days.
Initial download of the metrics may take a while.