Fig. 28
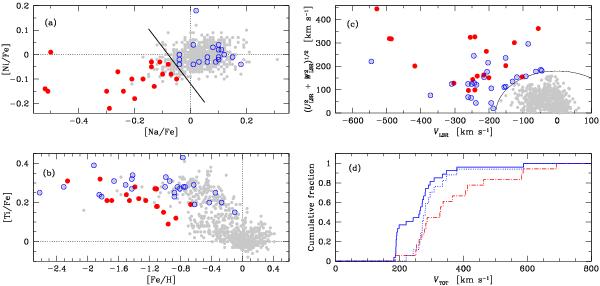
a) [Ni/Fe] – [Na/Fe] for the sample where the solid line marks the approximate separation between the low-α and high-α halo populations discovered by Nissen & Schuster (2010). Stars that have a total space velocity greater than VTOT > 180 km s-1 have been marked by open blue circles if located on the upper-right side of the dividing line, and by solid red circles if located on the lower-left side. b) [Ti/Fe] – [Fe/H] for the sample with the same coding as in a). c) Toomre diagram with the same coding as in a). The curved line marks VTOT = 180 km s-1. d) Cumulative distributions of VTOT: dashed red line represents the red stars in a)–c), solid blue line the blue stars in a)–c), and dotted blue line the blue stars in a)–c) but only including stars with VTOT > 200 km s-1.
Current usage metrics show cumulative count of Article Views (full-text article views including HTML views, PDF and ePub downloads, according to the available data) and Abstracts Views on Vision4Press platform.
Data correspond to usage on the plateform after 2015. The current usage metrics is available 48-96 hours after online publication and is updated daily on week days.
Initial download of the metrics may take a while.