Fig. 20
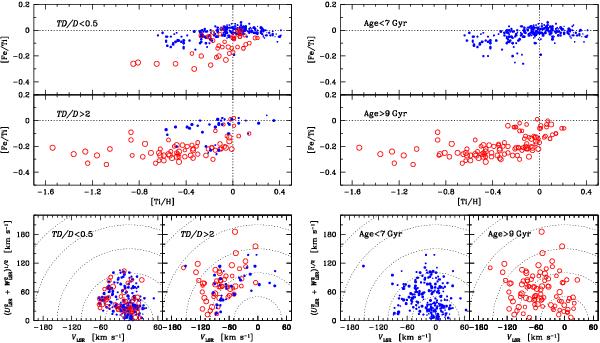
Left-hand side plots show the [Fe/Ti] versus [Ti/H] abundance trends when using the kinematical criteria as defined in Bensby et al. (2003, 2005). Stars have been colour- and size-coded depending on their ages. Right-hand side plots shows the abundance trends when splitting the sample according to their ages (as indicated). For all plots we have only included stars whose ages have been better determined than 4 Gyr (difference between upper and lower age estimates).
Current usage metrics show cumulative count of Article Views (full-text article views including HTML views, PDF and ePub downloads, according to the available data) and Abstracts Views on Vision4Press platform.
Data correspond to usage on the plateform after 2015. The current usage metrics is available 48-96 hours after online publication and is updated daily on week days.
Initial download of the metrics may take a while.