Free Access
Fig. 15
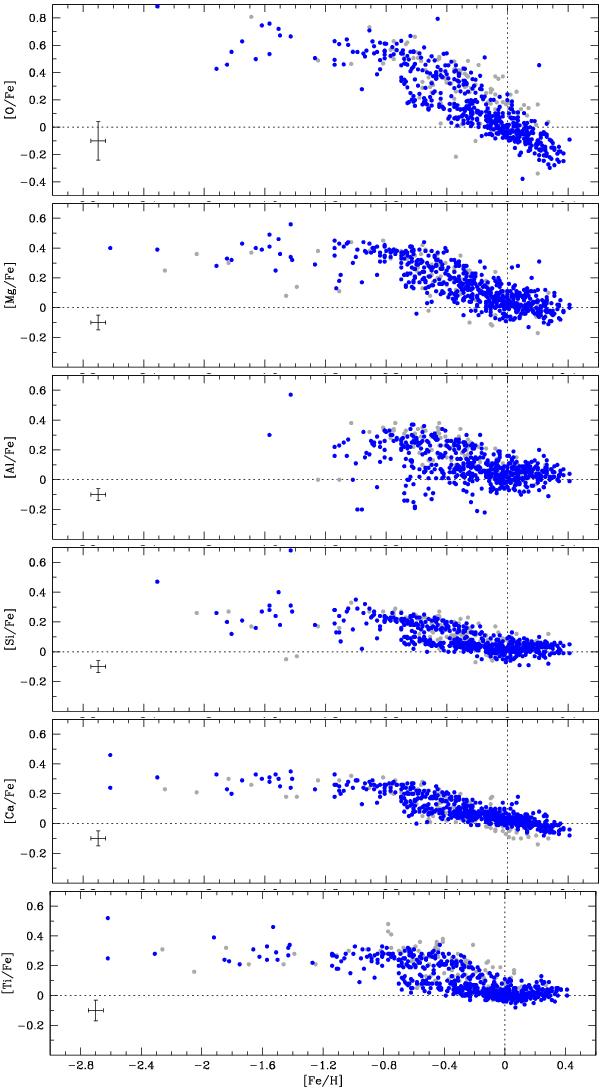
[X/Fe] versus [Fe/H] plots for the α-elements (O, Mg, Si, Ca and Ti) and the light element Al. The full sample of 714 stars is shown and black dots show the 604 stars with Teff > 5400 K and grey dots the stars with Teff < 5400 K. A typical error bar is shown in each plot.
Current usage metrics show cumulative count of Article Views (full-text article views including HTML views, PDF and ePub downloads, according to the available data) and Abstracts Views on Vision4Press platform.
Data correspond to usage on the plateform after 2015. The current usage metrics is available 48-96 hours after online publication and is updated daily on week days.
Initial download of the metrics may take a while.