Fig. 8
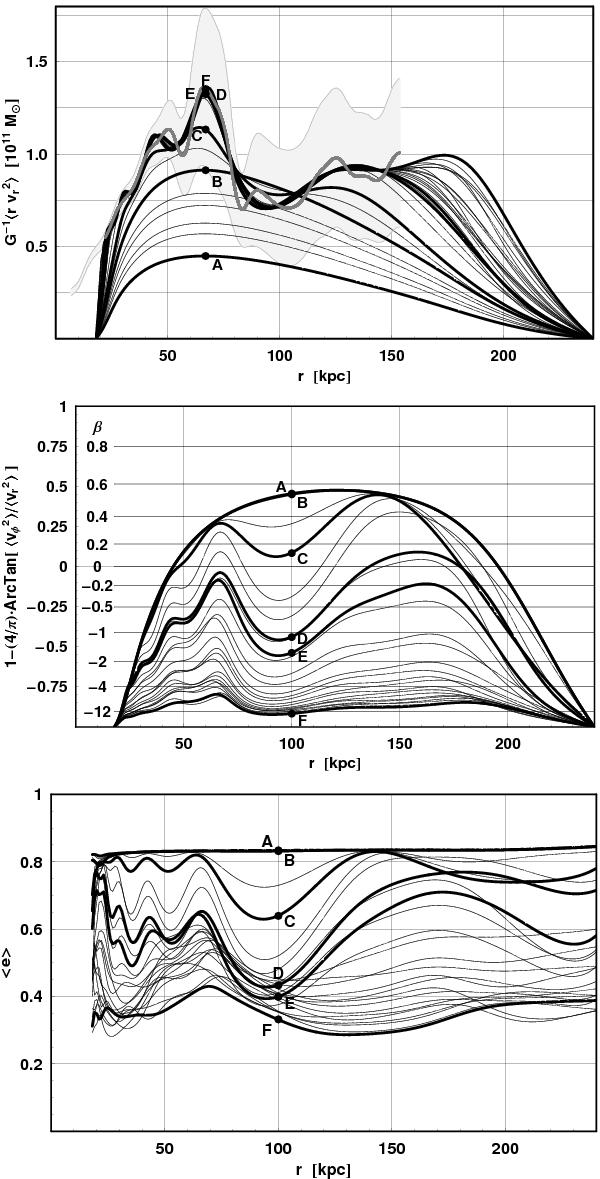
Top: example best-fit curves to the RVD profile of sample SII for masses ranging from 0.5 × 10¹¹ M⊙ to 10 × 1011 M⊙ (A: 0.5 × 10¹¹ M⊙, B: 1.02 × 10¹¹ M⊙, C: 1.3 × 10¹¹ M⊙, D: 2.09 × 10¹¹ M⊙, E: 2.4 × 10¹¹ M⊙, F: 10.2 × 10¹¹ M⊙), assuming d = 8 and ua = 18 kpc, ub = 240 kpc (⇒0 < e < 0.83). The light gray region is the uncertainty in the RVD profile corresponding to vertical bars in Fig. 3. Middle: corresponding (symmetrized) anisotropy parameter. Bottom: mean eccentricity.
Current usage metrics show cumulative count of Article Views (full-text article views including HTML views, PDF and ePub downloads, according to the available data) and Abstracts Views on Vision4Press platform.
Data correspond to usage on the plateform after 2015. The current usage metrics is available 48-96 hours after online publication and is updated daily on week days.
Initial download of the metrics may take a while.