Fig. 3
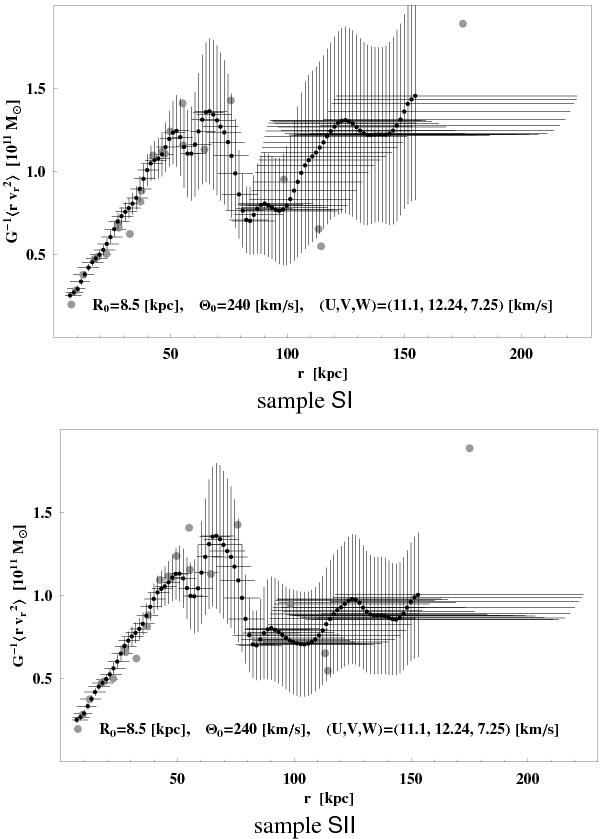
Radial velocity dispersion (RVD) profiles  for tracers with
 (the SI
sample, top panel); and
(the SI
sample, top panel); and  (the SII
sample, bottom panel). The horizontal bars represent the effective
radial bin size of the moving average. The vertical bars indicate the spread in the
RVD due to the inclusion/exclusion of random subsets of tracers. A detailed
description of how these profiles were obtained can be found in Sect. 2.3. As reference values, we show
(the SII
sample, bottom panel). The horizontal bars represent the effective
radial bin size of the moving average. The vertical bars indicate the spread in the
RVD due to the inclusion/exclusion of random subsets of tracers. A detailed
description of how these profiles were obtained can be found in Sect. 2.3. As reference values, we show
 calculated based on the RVD points in Xue et al.
(2008) and Deason et al. (2012b)
(large gray circles). Note that Leo I was excluded from our analysis. See also the
comparison of the profiles in Fig. 4.
calculated based on the RVD points in Xue et al.
(2008) and Deason et al. (2012b)
(large gray circles). Note that Leo I was excluded from our analysis. See also the
comparison of the profiles in Fig. 4.
Current usage metrics show cumulative count of Article Views (full-text article views including HTML views, PDF and ePub downloads, according to the available data) and Abstracts Views on Vision4Press platform.
Data correspond to usage on the plateform after 2015. The current usage metrics is available 48-96 hours after online publication and is updated daily on week days.
Initial download of the metrics may take a while.