Fig. 3
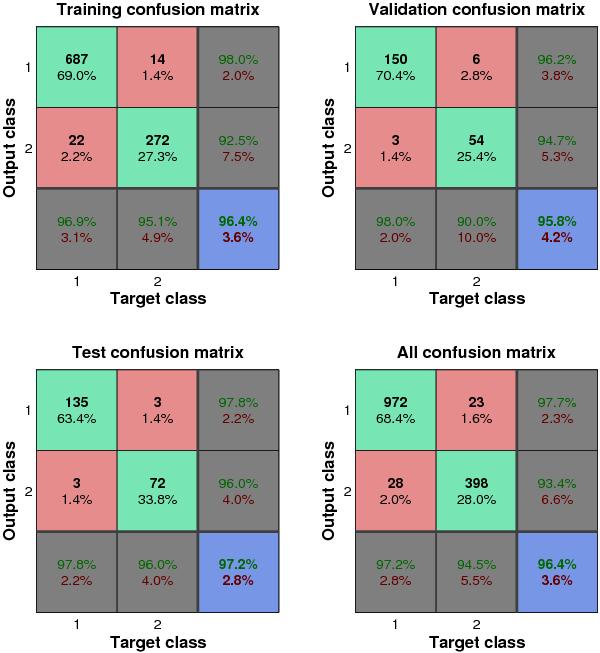
Confusion matrices for training, testing, and validation, and the three kinds of data combined for setting the MPG threshold to 12 + log (O/H) = 8.0 using all 9 variables. The diagonal cells show the number of cases that were correctly classified, and the off-diagonal cells show the misclassified cases. The blue cell in the bottom right shows the total percent of correctly classified cases (in green) and the total percent of misclassified cases (in red).
Current usage metrics show cumulative count of Article Views (full-text article views including HTML views, PDF and ePub downloads, according to the available data) and Abstracts Views on Vision4Press platform.
Data correspond to usage on the plateform after 2015. The current usage metrics is available 48-96 hours after online publication and is updated daily on week days.
Initial download of the metrics may take a while.