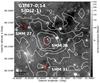
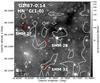
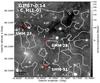
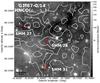
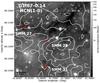
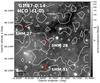
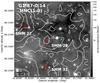
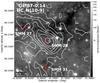
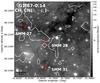
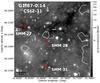
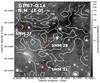
Fig. B.6

Similar to Fig. B.1 but towards G1.87−SMM 27, 28, 31. The contour levels start at 3σ for SiO, HN13C, C2H, CH3CN, and 13CS. For, HNCO(40, 4 − 30, 3), HNC, HCN, HCO+, HC3N, and N2H+, the contours start at 9σ, 7σ, 7σ, 4σ, 4σ, and 5σ, respectively. In all cases, the contours go in steps of 3σ. The average 1σ value in TMB units is ~ 0.63 K km s-1. The LABOCA 870 μm peak positions are marked by red plus signs. A scale bar indicating the 1 pc projected length is indicated. The SiO and HC3N emission morphologies resemble each other. HNC and N2H+ also share some common features (e.g. peak close to SMM 28).
Current usage metrics show cumulative count of Article Views (full-text article views including HTML views, PDF and ePub downloads, according to the available data) and Abstracts Views on Vision4Press platform.
Data correspond to usage on the plateform after 2015. The current usage metrics is available 48-96 hours after online publication and is updated daily on week days.
Initial download of the metrics may take a while.