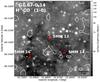
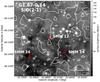
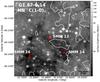
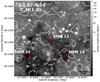
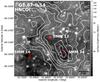
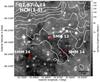
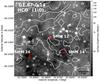
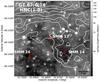
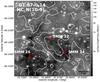
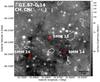
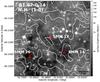
Fig. B.3

Similar to Fig. B.1 but towards G1.87−SMM 12, 14, 16. The contour levels start at 3σ for H13CO+, HN13C, C2H, HC3N, and CH3CN. For SiO, HNCO(40, 4 − 30, 3), HCN, HCO+, HNC, and N2H+, the contours start at 5σ, 15σ, 19σ, 10σ, 15σ, and 6σ, respectively. In all cases, the contours go in steps of 3σ. The average 1σ value in TMB units is ~ 0.63 K km s-1. The LABOCA 870 μm peak positions of the clumps are marked by red plus signs. A scale bar indicating the 1 pc projected length is indicated. The emissions of HNCO, HCN, HCO+, HNC, HC3N, and N2H+ are extended in a similar fashion, but the HNCO emission is clearly the strongest.
Current usage metrics show cumulative count of Article Views (full-text article views including HTML views, PDF and ePub downloads, according to the available data) and Abstracts Views on Vision4Press platform.
Data correspond to usage on the plateform after 2015. The current usage metrics is available 48-96 hours after online publication and is updated daily on week days.
Initial download of the metrics may take a while.